The Myth of the “Total View” Count

As a former pastor I can tell you every Monday morning, pastors and church leaders look at numbers. We look at the giving reports, the physical attendance in the pews, the number of kids in children’s ministry, and—increasingly over the last decade—the number of views on our church live stream.
For many of us, that final number can feel a bit hollow. We see a dashboard that says “200 Views” or “500 Views,” but we are left asking the same question: *What does that actually mean for our ministry?* Did 500 households worship with us from start to finish, or did 500 people accidentally click a link on Facebook while scrolling, only to leave three seconds later?
When technical teams talk about “streaming analytics,” it is easy for a pastor’s eyes to glaze over. It sounds like data networks, algorithms, and tech jargon. But at its core, streaming analytics is not a technical tool—it is a pastoral tool. It is the digital equivalent of standing at the back of the sanctuary, looking out at the congregation, and noticing who is engaged, who is slipping out early, and who is visiting for the first time.
1. Tracking Engagement: Knowing When You Have Their Attention
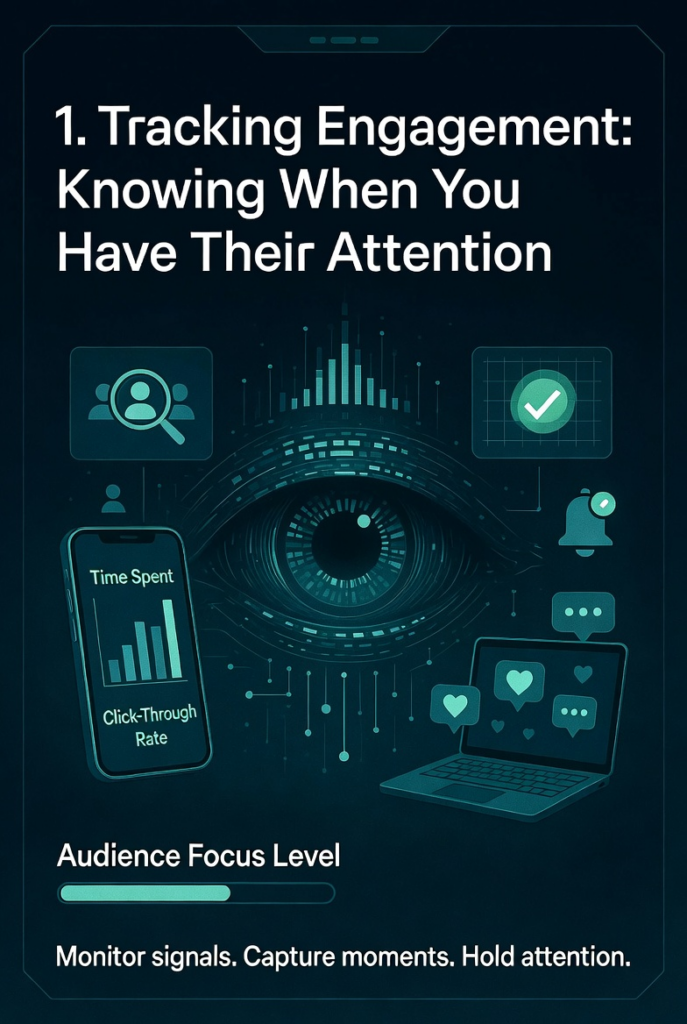
In a physical room, you can read the body language of your congregation. You know when a sermon point lands, and you can tell when people are starting to check their watches. Online, you cannot see their faces, but your streaming analytics can tell you their stories.
Instead of just looking at total clicks, analytics allow you to see your audience’s “average watch time.” For example, if your service runs 60 minutes, but your average watch time is only 12 minutes, that is an invaluable piece of pastoral feedback. It tells you that while people are interested enough to open the stream, something is causing them to drop off early. Are they running into technical buffering issues? Is the announcement segment at the beginning running too long? Understanding *how long* people stay helps your creative team build an online service experience that respects people’s time and keeps them engaged with the Gospel message.
“Data isn’t just about counting heads; it’s about learning how to better shepherd the hearts of the people who are showing up.”
2. The Digital Lobby: Identifying Your “Front Door” Visitors
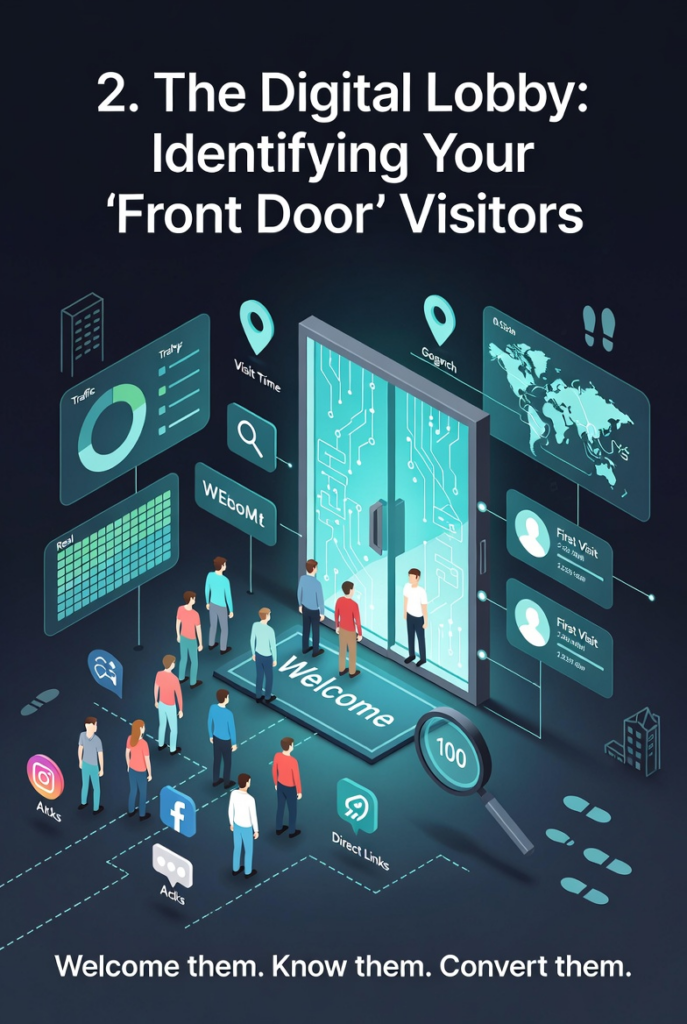
We invest heavily in our physical hospitality teams—ushers at the door, clear signage, and a welcoming lobby environment for visitors. But for a growing number of people in your community, your live stream *is* your front door. They will visit you online for weeks or even months before they ever step foot on your physical campus.
Analytics give you a clear picture of who is standing in your digital lobby. By looking at device data, you can see if your online attendees are watching on their mobile phones while on the go, sitting at a computer, or streaming the service through a Roku or Apple TV device in their living room. Knowing how they watch changes how you talk to them. If you know a large percentage of your online audience watches on their televisions at home, your campus pastors can intentionally look at the camera and welcome those “worshiping with us in their living rooms today,” making a passive screen feel like an interactive church home.
3. Mapping the Mission Field: Seeing Where Your Stream Travels

One of the most encouraging aspects of digital ministry analytics is the geographic heatmap. Most church streaming platforms can show you a map pinpointing exactly where your viewers are located. This information can completely reshape your outreach strategy. You might find a cluster of viewers living three towns over where you don’t currently have a physical presence—offering a perfect opportunity to launch a local small group or home watch party. Alternatively, you might discover that military families who used to belong to your church are still faithfully tuning in from bases across the world, allowing you to pastoral care for them even from thousands of miles away. The data helps you see exactly where God is blowing the seeds of your ministry beyond your local street address.
4. Managing Stewards and Resources Wisely
Every dollar in a church budget is a resource entrusted by God for ministry. Streaming video requires an investment in internet bandwidth, software subscriptions, and hardware support.
Analytics help church boards and finance committees make data-driven decisions rather than emotional ones. If the data shows that your live audience on Sunday morning is relatively small, but hundreds of people are watching the recorded video-on-demand files throughout the week, it frees your staff from stress. Instead of staying up until midnight trying to fix a live broadcast issue, you can confidently invest more time into editing, mastering, and polishing high-quality video archives that people can access on their own schedules.
Moving Forward with Clarity

The next time your media team hands you a report filled with charts and graphs, don’t look at it as a spreadsheet of numbers. Look at it as a map of your digital parish.
Use the data to ask better questions: How can we make it easier for these online viewers to submit a prayer request? How can we move them from being passive screen-watchers to active, connected participants in our community? When we view analytics through the lens of shepherding, data stops being a tech chore and becomes a powerful partner in completing the Great Commission.
At StreamingChurch.tv, we provide excellent analytics to help you be better at what you do. Because ministry isn’t just about broadcasting content—it’s about building a community. When you understand how your people are connecting, you can serve them more effectively, refine your message, and close the back door. Don’t leave your digital growth to guesswork. Let’s turn your data into ministry momentum. Reach out to us at StreamingChurch.tv